2026 State Performance Measures Program Report
In 2010, the Legislature created the Council on Local Results and Innovation. In February 2011, the Council released a standard set of ten performance measures for counties and ten performance measures for cities that will aid residents, taxpayers, and state and local elected officials in determining the efficacy of counties and cities in providing services and measure residents' opinions of those services. In February of 2012, the Council created a comprehensive performance measurement system for cities and counties to implement. In 2013, the Council revised the performance measures and clarified the system requirements to increase participation in the program.
Participation in the standard measures program by a city or a county is voluntary. Counties and cities that choose to participate in the standard measures program must officially adopt and implement the ten minimum performance measures and system developed by the Council. Olmsted County has been a voluntary participant since 2011.
Per the Council’s reporting requirements, a copy of the resolution approved by the Olmsted County Board to participate in this program will be submitted electronically to the Minnesota Office of the State Auditor.
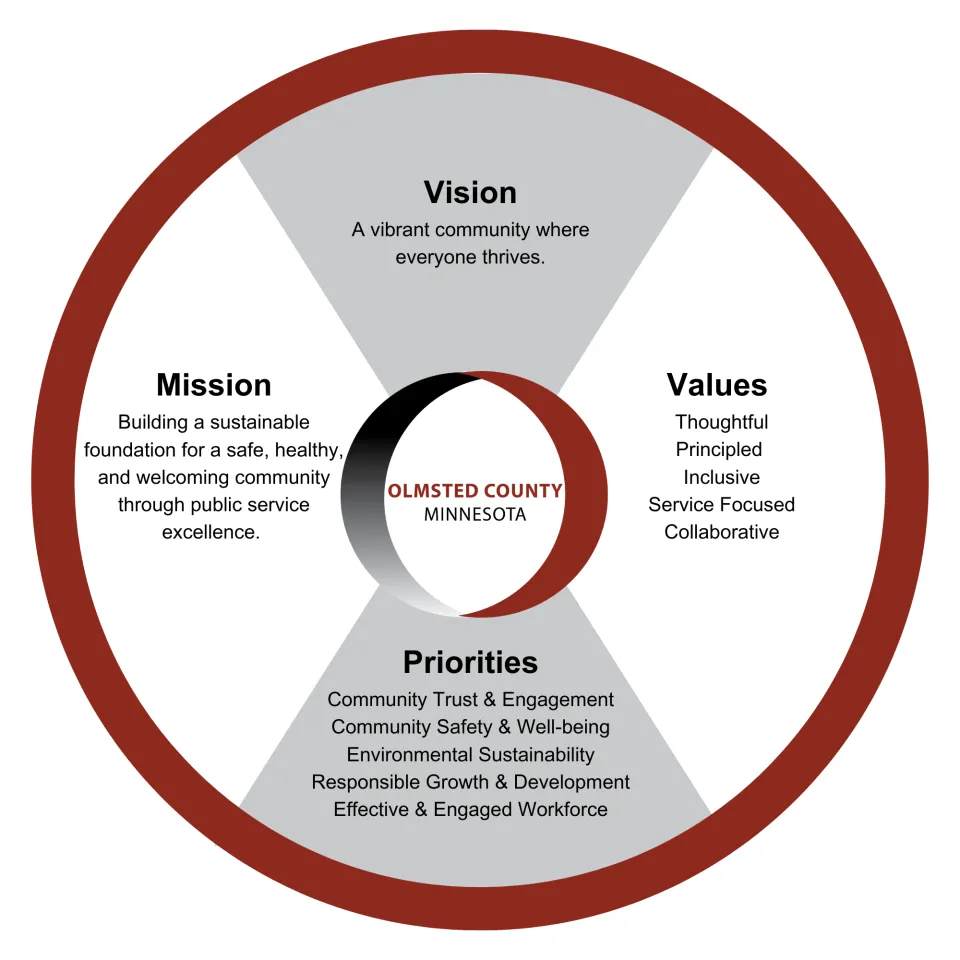
In 2024, Olmsted County adopted a new strategic plan for 2024-2028. High-level priorities are shown in the logo below along with the updated Mission/Vision/Values. Performance measures presented on this page are tied to several of these high-level priorities. The priorities have been highlighted in red below with performance measures embedded under each priority. Next to each priority are current initiatives in the county that impact these measures.
*Alignment with the priority Effective and Engaged Workforce is not shown below as that is a priority internally focused within the county while the other priorities are more community oriented
Priority: Community Safety and Well-Being
Public Safety
Data Source: Dodge & Olmsted Counties Community Corrections Department
Performance Measure: Adult Recidivism Rate after Supervision
Goals
Target Goal: 85% of D&O felony case probationers remain free of felony conviction for 3 years after discharge.
5 Year Trend Actual Results
- 2021: 90%
- 2022: 90%
- 2023: 90%
- 2024: 90%
- 2025: 85%
Goal Met
Target Goal: 75% of D&O supervised releases remain free of a felony conviction for 3 years after discharge.
5 Year Trend Actual Results
- 2021: 66%
- 2022: 73%
- 2023: 77%
- 2024: 69%
- 2025: 75%
Goal Met
Initiatives
Initiatives impacting performance metrics:
- Coordinate Olmsted County Drug Court
- Partner with Damascus Way Halfway House Program
- Apply Research-driven practices
- Teach Cognitive Skills Programming
- Use Validated Risk Needs Assessment
- Provide Intensive Supervision
- Offer Domestic Violence Education and Treatment
- Prioritize supervision and treatment interventions to higher-risk clients
- Target interventions to reduce risk
- Utilize effective communication and motivation interview strategies to enhance positive change
- Dosage Probation
Public Health
Data Source: 2024 CDC U.S. life expectancy: Products - Data Briefs - Number 548 - January 2026
2021 life expectancy for Minnesota: FastStats - Life Expectancy
Performance Measure: Life Expectancy
Goals
Target Goal: Life expectancy higher than U.S. average of 79.0 years
5 Year Trend Actual Results
- 2020: 80.6*
- 2021: 80.0*
- 2022: 79.3*
- 2023: 81.2
- 2024: 81.2
Goal Met
Target Goal: Life expectancy higher than Minnesota average of 78.8 years.
5 Year Trend Actual Results
- 2020: 80.6*
- 2021: 80.0*
- 2022: 79.3*
- 2023: 81.2
- 2024: 81.2
Goal Met
Initiatives impacting performance metrics:
- Promote Healthy Communities and Healthy Behaviors
- Assure the Quality and Accessibility of Health Services
- Prevent the Spread of Infectious Diseases
- Prepare for and Respond to Disasters and Assist Communities in Recovery
- Protect Against Environmental Hazards
- Assure an Adequate Local Public Health Infrastructure
*Note: In 2026 Olmsted County Public Health transitioned to a new mortality format that uses a
different life expectancy equation for smaller counties. This led to updates in results for previous
years. Despite this change, Olmsted County continues to have a higher life expectancy than the
U.S. or the State of Minnesota.
Social Services
Data Source: Olmsted County Child & Family Services Department
Performance Measure: Maltreatment Recurrence Rate
Goal
Target Goal: 90.9% of confirmed reports of child maltreatment during reporting year remain free of another confirmed maltreatment report within 12 months of the initial report.
5 Year Trend Actual Results
- 2021: 95.3%
- 2022: 100.0%
- 2023: 100.0%
- 2024: 100.0%
- 2025: 90.3%*
Goal Not Met
Initiatives impacting performance metrics:
- Collaborate with law enforcement, medical personnel, community partners (e.i. schools and community agencies) and other agency staff working with the family as well as extended family member and friends
- Engage with the entire family system to partner and work toward solutions together
- Utilize differential response and increased utilization of early intervention services and welfare-based services to prevent need for child protection services
- Use Family Involvement Strategies (FIS): Case Planning Conferences and Family Group Conference
*Note: To achieve this performance measure, no more than six children may experience a repeat maltreatment finding. In 2025, Olmsted County recorded 6 out of 62 children with this finding. It is important to note that five of these children were members of the same sibling group. Because the metric counts each child individually rather than measuring by family unit, the result may appear elevated when multiple siblings are involved in a single case.
Priority: Responsible Growth and Development
Veteran Services
Data Source: Olmsted County Administration; overall % veteran to county population from Census American Community Survey (ACS) 2024 5-Year Estimates. Federal dollars per veteran from 2024 VA Expenditures GDX Report and VA Population Model (VetPop2023) estimates for 2024.
Performance Measure: Federal dollars brought into the county for veteran’s benefits
Changes
Changes: % of Veteran population to overall county population. No target goal just track year-to-year changes.
5 Year Trend Actual Results
- 2020: 5.3%
- 2021: 5.2%
- 2022: 6.4%
- 2023: 6.0%
- 2024: 5.9%
Changes: Average Federal benefit dollars per veteran brought into county per year. No target goal just track year-to-year changes.
5 Year Trend Actual Results
- 2020: $6.095
- 2021: $6,784
- 2022: $8,066
- 2023: $9,282
- 2024: $9,592
Initiatives impacting performance metrics:
- Provide outreach to homebound veterans and those in nursing facilities to assist in obtaining federal, state and local benefits
- Make claims for death benefits, Death Pension or Dependency and Indemnity Compensation
Finance
Data Source: Olmsted County Finance Department
Performance Measure: Bond Rating
Goal
Target Goal: Standard and Poors Bond at AAA Rating.
5 Year Trend Actual Results
- 2021: Year not Rated
- 2022: AAA
- 2023: AAA
- 2024: Year Not Rated
- 2025: Year Not Rated
Not Applicable
Target Goal: Moody’s Investors Services at Aaa Rating.
5 Year Trend Actual Results
- 2021: Aaa
- 2022: Aaa
- 2023: Aaa
- 2024: Aaa
- 2025: Aaa
Goal Met
Initiatives impacting performance metrics:
- Internal Control Systems
- Regular involvement by finance staff of the qualitative judgement of programmatic managers in budget development, monitoring and financial forecasting
- One-time revenues (uncertain funding streams) are linked to one-time expenditures to avoid building instability into the budget
- The goal to maintain fund balances between 35% to 50% of operating revenues in our Governmental Funds
- A five-year capital improvement plan for major public improvements is reviewed and updated annually
- Our self-insurance health plan is modeled out five years for rate setting purposes
- Extensive use of self-supporting internal service funds to account for overhead costs
Priority: Environmental Sustainability
Public Works
Data Source: Olmsted County Public Works Department
Performance Measure: Hours to Plow Complete System during a Snow Event
Goal
Target Goal: Substantially bare pavement within 48 hours on principal arterial roadways.
5 Year Trend Actual Results
- 2021: Met
- 2022: Met
- 2023: Met
- 2024: Met
- 2025: Met
Goal Met
Target Goal: Substantially bare pavement within 72 hours on minor arterial roadways.
5 Year Trend Actual Results
- 2021: Met
- 2022: Met
- 2023: Met
- 2024: Met
- 2025: Met
Goal Met
Initiatives impacting performance metrics:
- Maintain roads in a reasonable, safe, and serviceable condition throughout winter
- Reduction of Salt Usage for Environmental Benefits
- Secure adequate capital improvement funding
- Pavement Preservation projects for at least 15 miles annually
Environment
Data Source: Olmsted County Environmental Resources Department
Performance Measure: Recycling & Solid Waste Processing
Goal
Target Goal: Recycling Rate greater than 45%
5 Year Trend Actual Results
- 2021: 44%
- 2022: 42%
- 2023: 39%
- 2024: 42%
- 2025: 40%
Goal Not Met
Target Goal: Waste-to-Energy Facility Processible Waste Rate greater than 90%.
5 Year Trend Actual Results
- 2021: 97%
- 2022: 102.7%*
- 2023: 100.4%*
- 2024: 100%
- 2025: 101.3%
Goal Met
Target Goal: Hazardous Waste Program Household Participation Rate greater than 10%.
5 Year Trend Actual Results
- 2021: 17%
- 2022: 16%
- 2023: 16%
- 2024: 16%
- 2025: 15%
Goal Met
Initiatives impacting performance metrics:
- Advance the design and implementation of a local Materials Recovery Facility (MRF) to significantly improve recycling rates by capturing more recoverable materials. This facility will enable waste to be diverted higher up the waste hierarchy, reducing dependency on Olmsted’s waste-to-energy facility (OWEF) and impacts to its infrastructure.
- Create a cohesive, recognizable public education program aimed at increasing waste diversion and reuse through community engagement and behavior change. The branded education and outreach campaign will also focus on safe disposal practices for hazardous and problematic items such as lithium batteries, propane tanks, and pressurized canisters.
- Develop and execute a countywide strategic waste diversion plan that identifies and targets high-volume recyclable materials currently being sent to the OWEF or landfill. The plan will guide policies, programs, and infrastructure improvements to optimize recovery and reduce overall waste generation.
*Note: Greater than 100% as waste was reclaimed the prior year from the Kalmar Landfill Municipal Solid Waste (MSW) Bypass Cell and processed at the Waste-to-Energy Facility.
Priority: Community Trust and Engagement
Elections
Data Source: Olmsted County Property Records & Licensing Department. Population data based on July
1st, 2023 U.S. Census Bureau
Performance Measure: Post-Election Audit Accuracy
Goal
Target Goal: Voting system/hand count reconciliation variance (only measured during statewide election years). Total variance from reconciliations of three random precincts: Less than 0.5%.
4 Election Cycle Trend Actual Results
- 2018: 0.0%
- 2020: 0.0%
- 2022: 0.0%
- 2024: 0.0%
Goal Met
Initiatives impacting performance metrics:
- Prepare ballots and tabulating system for 110 precincts for an estimated population of 164,784 with 104,248 registered voters
- Train 1000+ election judges every 2 years
Property, Records, Valuation & Assessment (A)
Data Source: Olmsted County Property Records & Licensing Department
Performance Measure: Taxation Assessment Accuracy (Assessment Year)
Goal
Target Goal: Residential median assessment ratio: 90%-105%.
5 Year Trend Actual Results
- 2022: 91.1%
- 2023: 96.3%
- 2024: 94.5%
- 2025: 93.8%
- 2026: 95.2%
Goal Met
Target Goal: Commercial median assessment ratio: 90%-105%.
5 Year Trend Actual Results
- 2022: 97.5%
- 2023: 89.9%
- 2024: 94.1%
- 2025: 93.1%
- 2026: 94.8%
Goal Met
Target Goal: Apartment median assessment ratio: 90%-105%
5 Year Trend Actual Results
- 2022: 93.0%
- 2023: 95.1%
- 2024: 96.9%
- 2025: 95.9%
- 2026: 99.7%
Goal Met
Target Goal: Agriculture median assessment ratio: 90%-105%.
5 Year Trend Actual Results
- 2022: 92.6%
- 2023: 93.6%
- 2024: 95.6%
- 2025: 92.8%
- 2026: 102.6%
Goal Met
Initiatives impacting performance metrics:
- Rochester continues to experience slight increases in the Residential market. Assessors have raised Residential estimated market values an average of 2-4%.
- An assessment aides assist Assessment Services personnel in revaluation.
Property, Records, Valuation & Assessment (B)
Data Source: Olmsted County Property Records & Licensing Department
Performance Measure: Real Estate Document Recording, Indexing & Return Rate
Goal
Target Goal: 95% of e-Recorded Documents Turned Around in 5 Days or less.
5 Year Trend Actual Results
- 2021: 2 Days
- 2022: 2 Days
- 2023: 2 Days
- 2024: 2 Days
- 2025: 2 Days
Goal Met
Target Goal: 95% of Paper Recorded Documents Turned Around in 10 Days or less.
5 Year Trend Actual Results
- 2021: 8 Days
- 2022: 6 Days
- 2023: 5 Days
- 2024: 4 Days
- 2025: 3 Days
Goal Met
Initiatives impacting performance metrics:
- Increase imaged documents to provide improved disaster recovery and online access to documents.